The ‘NR’ module includes a REM helper that enables visualizing the 2D spatial radiation maps (in terms of SNR, SINR and IPSD) of one or multiple devices, including directional, omnidirectional, and sectorized radiation patterns, in downlink and uplink directions. The IPSD (Interference Power Spectral Density) corresponds to the aggregated received power of all signals at each rem point (treated as interference). In particular, in the REM maps, for each point on the map (rem point) a rem value is calculated (SNR/SINR/IPSD), and we use the following terminologies: RTD(s) -> rem transmitting device(s), RRD -> rem receiving device.
As general case, the rem point is configured according to the RRD passed to the helper (e.g., antenna configuration). Two general types of maps can be generated:
- BeamShape: This map considers the configuration of the beamforming vectors (for each RTD) as defined by the user in the scenario script for which the REM maps (SNR/SINR/IPSD) are generated.
- CoverageArea: In this map, the beams are reconfigured during the map generation for each rem point in order to visualize the coverage area in terms of SNR, SINR, and IPSD.
Some examples of the REM maps that can be extracted with 5G-LENA simulator are shown next.
Simple 2 gNB deployment
Beam Shape map
Examples of the BeamShape map are given in the next figure. The two figures on the top depict the SNR (left) and SINR (right) for the case of two gNBs with an antenna array of Isotropic antenna elements, while the two figures on the bottom correspond to an antenna array of directional (3GPP) antenna elements.
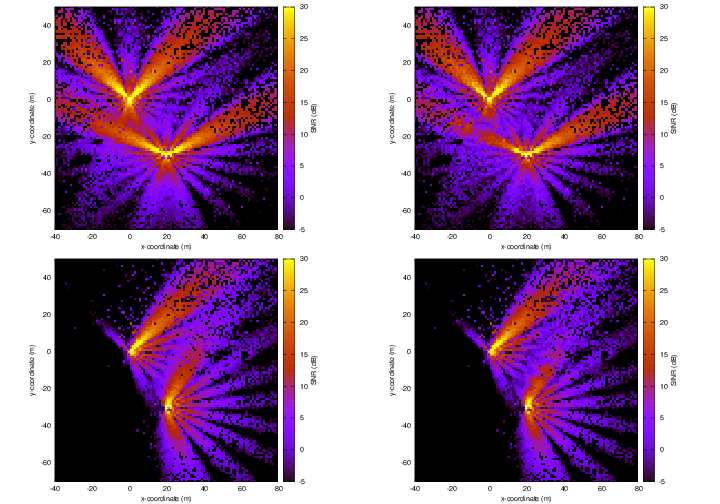
Configuration parameters are:
- Positions: gNB1 (0, 0, 1.5), gNB2 (20, -30 , 1.5), UE1 (10, 10, 1.5), UE2 (50, -15 , 1.5) (top), UE2 (25, -15 , 1.5)(bottom)
- gNB antenna array 8x8 with 3GPP/ISO antenna elements
- REM point antenna array 1x1 with ISO antenna element
- Frequency band: 28GHz, with 100MHz channel bandwidth
- gNB transmit power: 1 dBm
- Noise power spectral density: -174dBm/Hz, 5dBi noise figure
Coverage Area map
Examples of the CoverageArea map are given in the next figure. The two figures on the top depict the SNR (left) and SINR (right) for the case of two gNBs with an antenna array of Isotropic antenna elements, while the two figures on the bottom correspond to an antenna array of directional (3GPP) antenna elements.
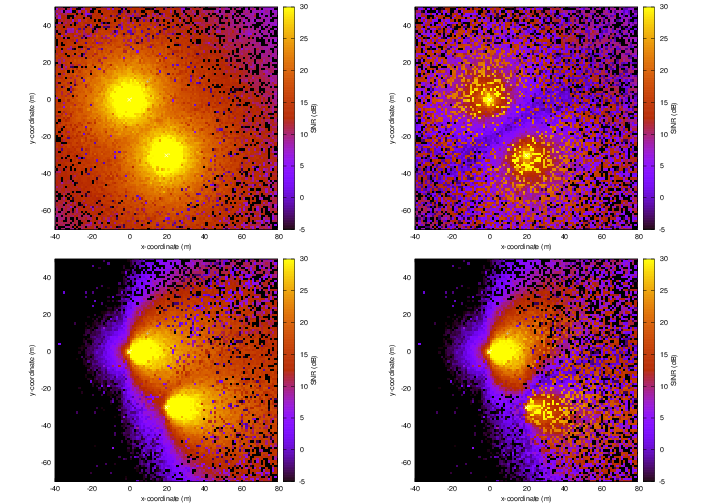
Configuration parameters are:
- Positions: gNB1 (0, 0, 1.5), gNB2 (20, -30 , 1.5)
- gNB antenna array 8x8 with 3GPP/ISO antenna elements
- REM point antenna array 1x1 with ISO antenna element
- Frequency band: 28GHz, with 100MHz channel bandwidth
- gNB transmit power: 1 dBm
- Noise power spectral density: -174dBm/Hz, 5dBi noise figure
Coverage Area map with buildings
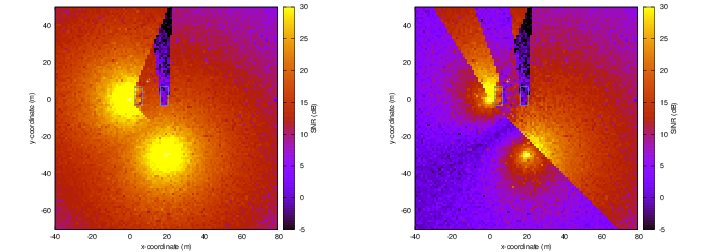
The REM helper of ‘NR’ module also allows the visualization of coverage holes when buildings are included in the deployment. An example is given in the next figure (left: SNR, right:SINR). Configuration is the same as for the previous map, for the case of isotropic antenna elements, but including two buildings in the scenario (shown with rectangles in the figure).
Hexagonal deployments
Downlink REM map
Next figure shows the SNR (left) and SINR (right) for an hexagonal deployment of macrocells, considering an Inter-Site Distance (ISD) of 1732m for the Urban case (top) and 7000m for the Rural case (bottom).
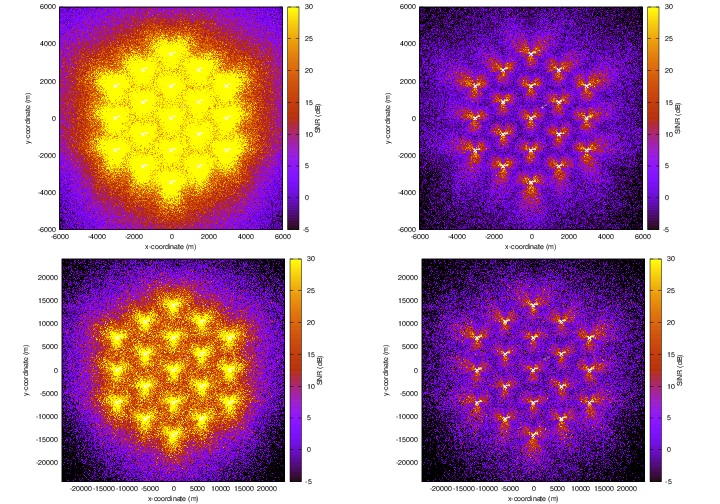
Configuration parameters are:
- Hexagonal grid layout, 3 sectors per site, 1732m ISD (Urban) and 7000m ISD (Rural)
- Macrocell antenna height: 30m (Urban) and 45m (Rural)
- Macrocell antenna array: 2x2 (3GPP elements)
- Macrocell transmit power: 43dBm/sector
- Channel model: 3GPP TR 38.901 UMa, LOS and NLOS
- Frequency band: 2 GHz, with 10MHz channel bandwidth
- Noise power spectral density: -174dBm/Hz
Uplink REM map
The following figure displays the total aggregated power (IPSD) across 342 UEs trasnmitting in uplink.
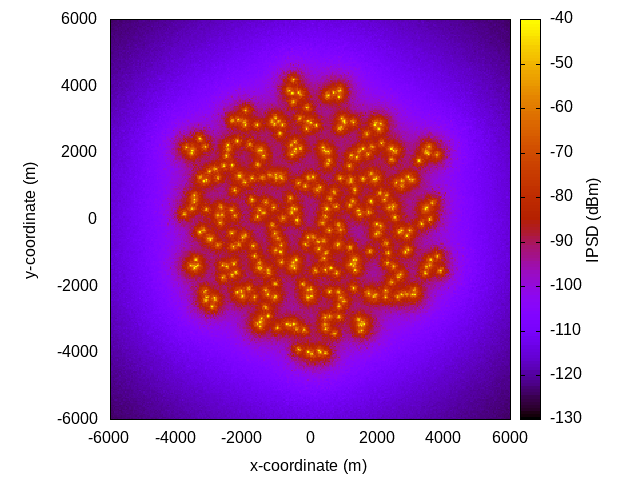
Configuration parameters are:
- Outdoor deployment of UEs, with uniform distribution
- UE antenna height: 1.5m
- UE antenna array: 1x1 (ISO elements)
- UE transmit power: 23dBm
- Channel model: 3GPP TR 38.901 UMa, LOS and NLOS
- Frequency band: 2 GHz, with 10MHz channel bandwidth
Downlink Heterogeneous Networks
The following figure shows the downlink SINR in an heterogeneous network deployment, composed of macrocells placed in an hexagonal grid with 1732m ISD and 3 randomly deployed smallcells.
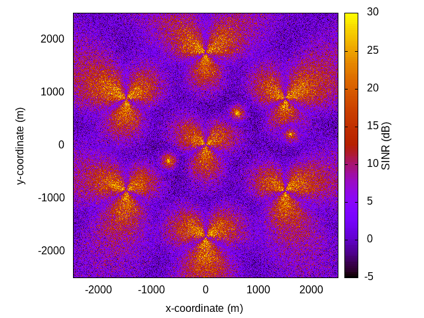
Configuration parameters are:
- Hexagonal grid layout, 3 sectors per site, 1732m ISD
- Macrocell antenna height: 30m, smallcell antenna height: 10m
- Macrocell antenna array: 2x2 (3GPP elements), smallcell antenna array: 2x2 (ISO elements)
- Macrocell transmit power: 43dBm/sector, smallcell transmit power: 30dBm
- Channel model: 3GPP TR 38.901 UMa, LOS and NLOS
- Frequency band: 2 GHz, with 10MHz channel bandwidth
- Noise power spectral density: -174dBm/Hz